In HCImage, one may view single image data graphically as a 2-D or 3-D Intensity Profile or as a 2-D or 3-D Intensity Histogram. In the Current View drop-menu, select Graph View to display image data as a 2-Dimensional Intensity Profile or select Histogram to see the data as a 2-Dimensional Intensity Histogram. In order to display a 3-D view of either graph right-click and select 3-D Graph.
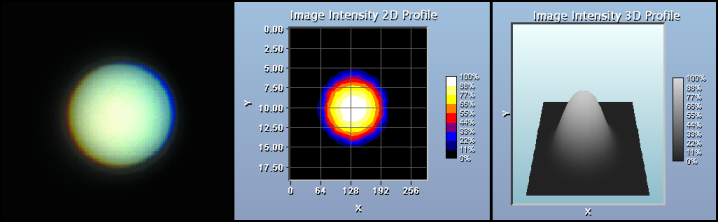
As mentioned above, the Graph View is a 2-Dimensional Profile View of the image data accessed through the Current View drop-menu. The graph shows the image pixel positions in the X-Y axes with the pixel intensity data represented by color. The 3-Dimensional Isometric view shows the image pixel positions in the X-Y axes and the pixel intensity data in the Z-axis.
The 3-D display can be rotated in all three planes by, click and holding the right mouse button. In order to return the display back to the default view, right-click, select 2-D View, then right-click and select 3-D View.
The right-click menu will display a list of graph and other controls including:
Note: The amount of data in a high-resolution image may be far too great to display with accuracy on the screen, so a Quality Factor is used to decrease the image data before rendering the view. Use this quality factor to increase interaction speed or for a preview, before selecting the final quality factor for the best picture.
A 2-Dimensional Intensity Distribution describes how many pixels are contained in the image document within various intensity-level ranges. Right-click and select 3-D Graph to display a 3-Dimensional histogram with various source-color channels drawn at various depths. The bins correspond to intensity (i.e. pixel value) and the width of the bins can be increased or decreased via the "Bin Increment"  and "Bin Decrement"
  toolbar buttons. Histogram bars will change to a line graph if the number of bins is increased until there is one bin for each of the intensity levels available.

Note: For monochrome images a single component histogram is displayed. For color images the Source Color Channels button is visible to permit choosing between "All Channels" or a single color component. While the Source Color Channel is set to "All Channels", the 2-D Histogram view will display a fourth data-set which is the histogram of the equivalent gray-scale image (such as the image which would be displayed after using the HCImage menu command "Color>>Grayscale").
To see the information numerically, either switch to a Table View or Spreadsheet View.
The zoom feature is only available in the 2-D Histogram. To zoom in on a particular area, just click and hold the left mouse button as you drag a box around the area of interest. Release the button and the graph zooms to the size of the box. Click the left mouse button to return to the normal view. While in a zoomed position the user can pan by dragging the mouse in the direction they wish to view.
The 3-D Histogram can be rotated in all three planes by click and holding the right mouse button. In order to return the display back to the default view, right-click, select 2-D View, then right-click and select 3-D View.
The right-click menu will display a list of graph and other controls including:
Note: Use the Histogram Table or Spreadsheet to see the intensity value distribution for the Red, Green and Blue Color Channels (and the equivalent monochrome intensity histogram). The Histogram Spreadsheet and Table views allow numerical inspection of the intensity value distribution information.